Level 1 Miss By Source
This report shows Cycles per Instruction or actual MIPS, Level 1 Miss Percentage and Relative Nest Intensity calculated from data from the SMF 113 records.
The values are shown with CPU Service by Service Class or Report Class information, so you can see how the values change with different workloads.
Report Information
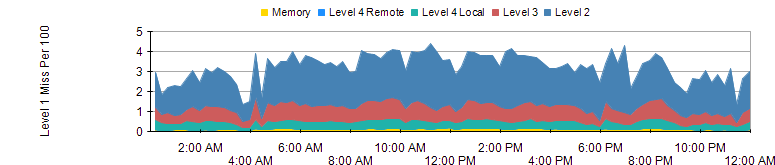
- Level 1 Miss by Source. The number of times data or instructions were fetched from the different cache levels. For a description of the different cache levels, refer to the CPU Measurement Facility Summary report documentation.
Level 1 Miss By Source, per 100 Instructions
Service by Service Class

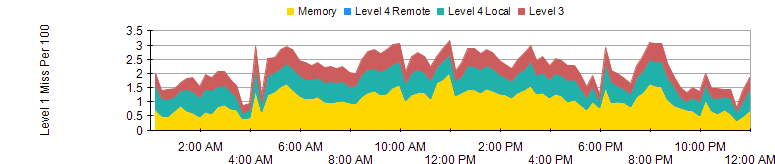
The Level 1 Miss chart can be weighted using the weights for the RNI calculation. This shows a RNI weighed chart for the same time frame. It shows how much more expensive misses sourced from memory are compared to sourcing from the processor cache.
Level 1 Miss By Source, per 100 Instructions
Report Parameters
| Parameter | Description |
|---|---|
| System | Select the system to display. |
| Service Class / Report Class | Show CPU Service by Service Class, or CPU Service by Report Class. |
| RNI Weighted | Multiply the number of cache fetches by the weighting factor used in the Relative Nest Intensity calculations. This gives a measure of the performance cost of level 1 misses, as well as the quantity. |
SMF records used for this report
| Type | Subtype |
|---|---|
| 113 | 2 |
| 72 | 3 |